Maths KS3 – 4.04.1 Creating scatter graphs
£3.50
Description
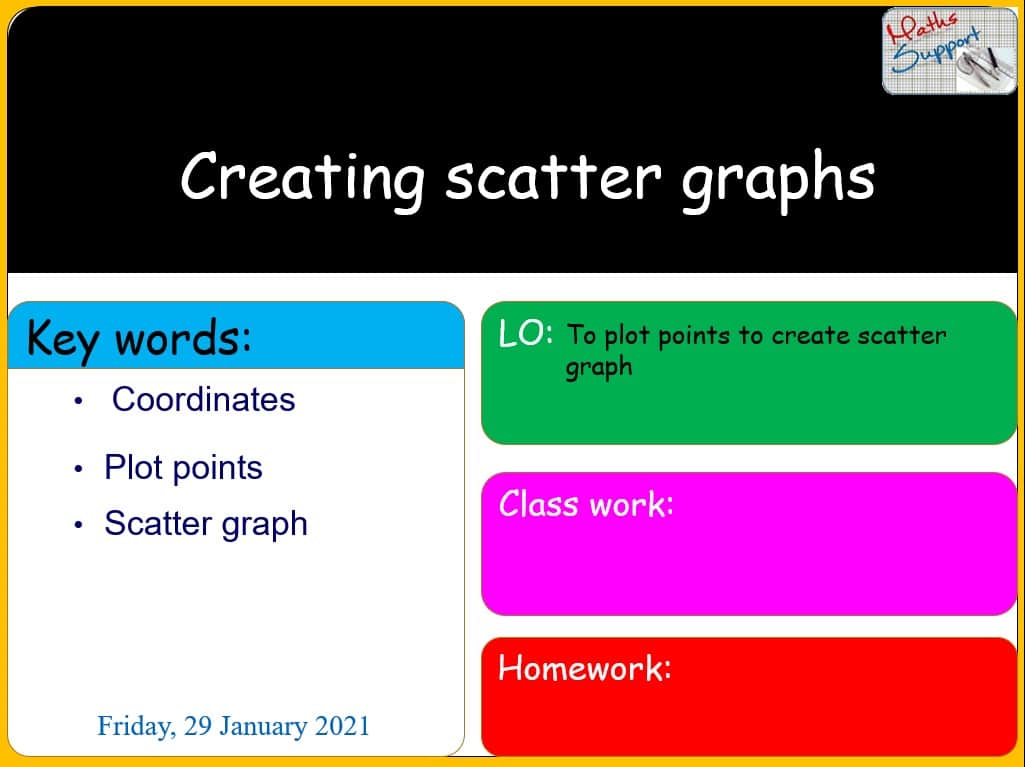
Creating scatter graphs – Maths KS3
Power Point presentation, 18 slides, Explaining with examples how to create a scatter diagram from a table, and how to use it to determine the correlation between the variables, based on KS3 Maths National curriculum.
Preview
Preview
Related products
-
Maths KS3 – 1.04.1 Divide in a given ratio
£3.50Divide in a given ratio – Maths KS3 Power Point presentation, 13 slides, Explaining with examples how to solve simple problems about ratio and proportion using […]
-
Maths KS3 – 1.02.1 Order of operations (BODMAS)
£3.50Order of operations (BODMAS) – Maths KS3 Power Point presentation, 12slides, Explaining the Order in which the operations are carried out to get the correct answer, […]
-
Maths KS3 – 1.03.1 Prime factors
£3.50Prime factors – Maths KS3 Power Point presentation, 12 slides, Explaining what prime factors are and how to find the prime factors of any number using […]


