Maths KS3 – 4.04.1 Creating scatter graphs
£3.50
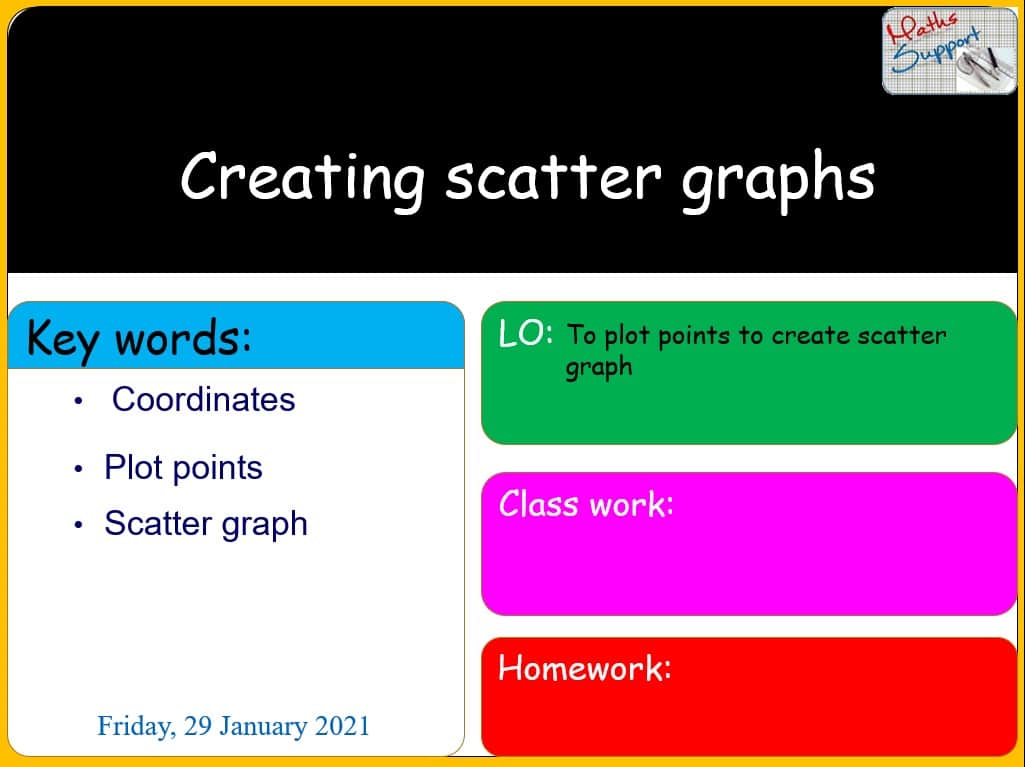
Creating scatter graphs – Maths KS3
Power Point presentation, 18 slides, Explaining with examples how to create a scatter diagram from a table, and how to use it to determine the correlation between the variables, based on KS3 Maths National curriculum.
Preview
Related products
-
Maths KS3 – 1.02.2 Methods of multiplication
£4.00Methods of multiplication – Maths KS3 Power Point presentation, 19 slides, Explaining the following written methods to carry out multiplications: Long multiplication, Grid method, Chinese method, […]
-
Maths KS3 – 2.05.1 Functions and mapping
£3.50Functions and mapping – Maths KS3 Power Point presentation, 11 slides, Explaining with examples how express simple functions algebraically and represent them in mapping diagrams, based […]
-
Maths IBAA – 5.090 Solving problems by integration
£4.00Solving problems by integration – Maths IBAA – SL Power Point presentation, 9 slides, Explaining how to use integration to solve daily-life problems involving rate of […]


