Maths KS3 – 2.06.2 Quadratic graphs from tables of values
£5.00
Description
Quadratic graphs from tables of values – Maths KS3
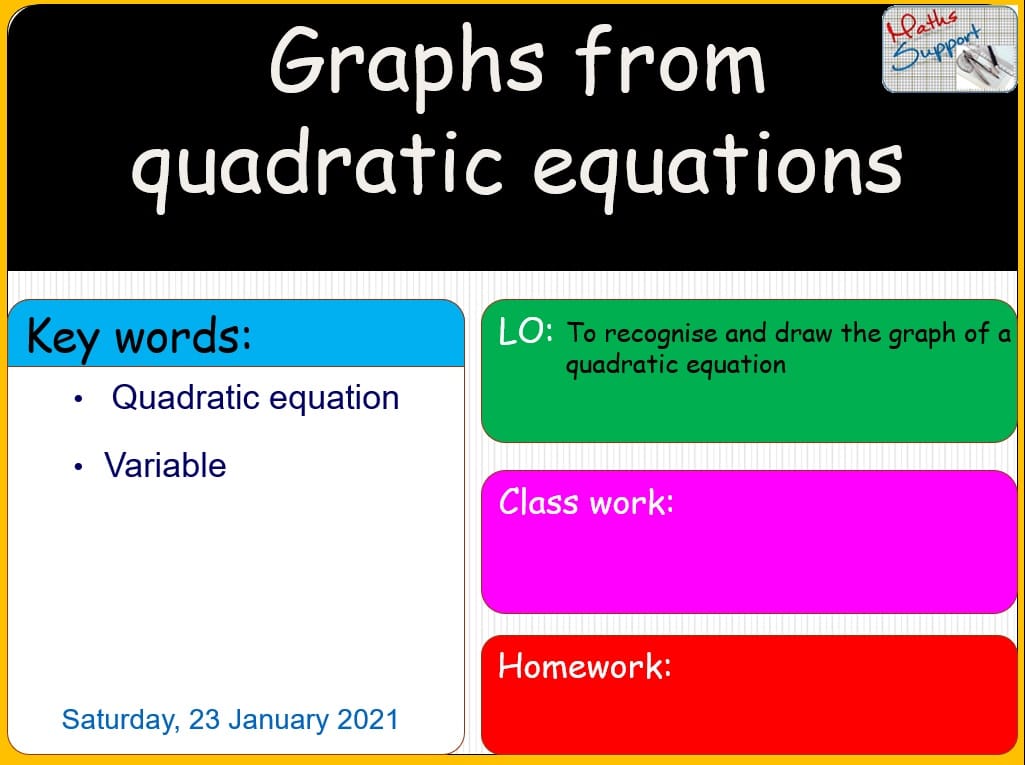
Power Point presentation, 15 slides, Explaining with examples how to create a table of values to find and plot points to draw the graph of a quadratic equation. It includes a worksheet along with its answer-sheet.Based on KS3 Maths National curriculum.
Preview
Preview
Reviews 0
Related products
-
Maths IBAI – 1.21 Arithmetic sequences
£5.00Arithmetic sequences – Maths IBAI – SL PowerPoint presentation, 10 slides, Explaining how to identify arithmetic sequences and how to find the nth term of an […]
-
Maths KS3 – 2.02.2 The nth term or a sequence
£3.50Find the nth term of a linear sequence – Maths KS3 Power Point presentation, 8 slides, Explaining with examples how to find the general term (nth […]
-
Maths IBAA – 5.061.1 The derivative of ln x
£4.00The derivative of ln x – Maths IBAA – SL Power Point presentation, 15 slides, explaining how to find the derivative of functions involving ln x, […]


Reviews
There are no reviews yet.