Maths IGCSE E3.6 Sketch the graph of a function
£3.50
Sketch the graph of a function – Maths IGCSE Extended
Power Point presentation, 24 slides, Explaining with examples how to create the sketch of a function from information given or transferring a graph from the screen of the GDC to paper, based on the IGCSE International Maths 0607 Syllabus.
You will get a PPTX file
PPTX files
Be sure that you have an application to open this file type before purchasing.
Related products
-
Maths KS3 – 2.02.2 The nth term or a sequence
£3.50Find the nth term of a linear sequence – Maths KS3 Power Point presentation, 8 slides, Explaining with examples how to find the general term (nth […]
-
Maths IGCSE E2.70 The distributive law
£3.50The distributive law – Maths IGCSE Extended Power Point presentation, 9 slides, Explaining with examples how to use the distributive law to expand brackets, based on […]
-
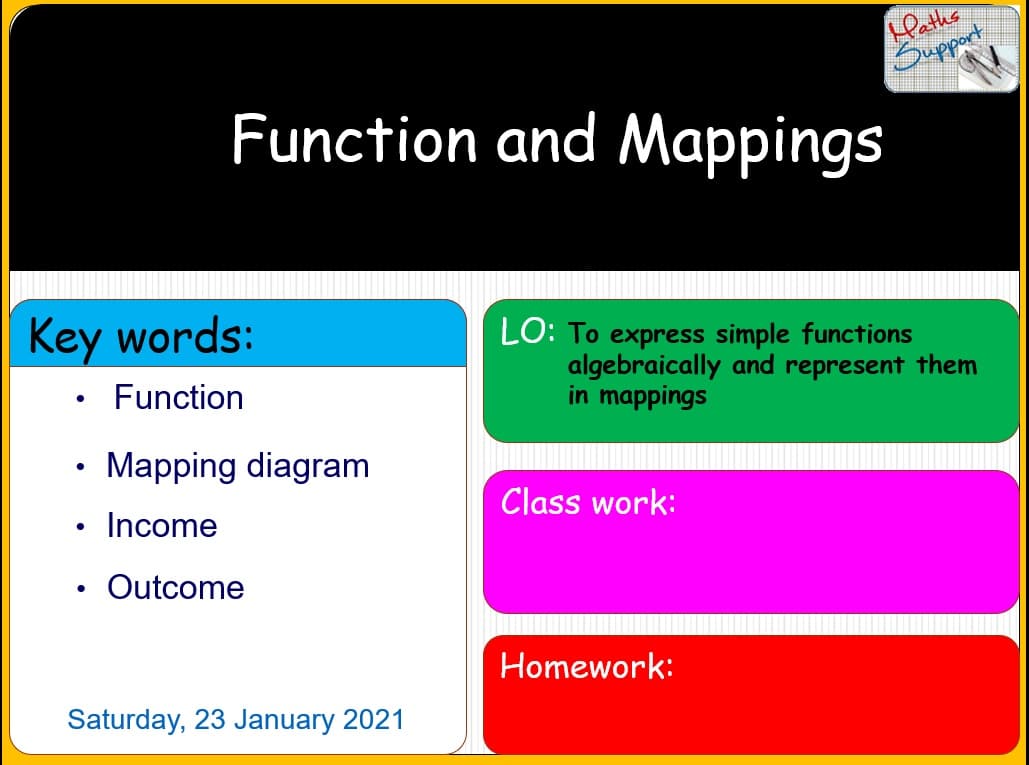
Maths KS3 – 2.05.1 Functions and mapping
£3.50Functions and mapping – Maths KS3 Power Point presentation, 11 slides, Explaining with examples how express simple functions algebraically and represent them in mapping diagrams, based […]