Maths IGCSE C3.61 Using the GDC to produce a table of values
£3.50
Description
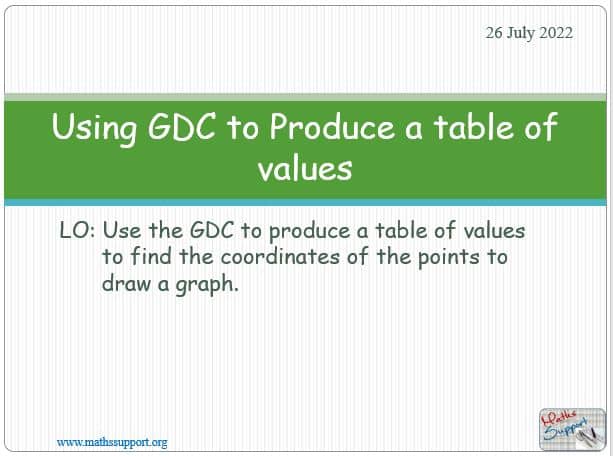
Using the GDC to produce a table of values – Maths IGCSE Core
Power point presentation with 15 slides explaining step by step how to use the GDC to produce a table of values to find the coordinates of the points to draw a graph. Based on the IGCSE Maths – Core Syllabus.
You will get a PPTX file
Preview
Preview
Related products
-
Maths IGCSE E2.71 The product (a + b)(c + d)
£3.50The product (a + b)(c + d) – Maths IGCSE Extended Power Point presentation, 11 slides, Explaining with examples how to expand two brackets. Use of […]
-
Maths KS3 – 2.03.1 Solving linear equations by balancing
£3.50Solving linear equations by balancing – Maths KS3 Power Point presentation, 14 slides, Explaining with examples how to solve simple linear equations using the balancing method, […]
-
Maths IGCSE E2.72 Expanding the difference of two squares
£3.50Expanding the difference of two squares – Maths IGCSE Extended Power Point presentation, 11 slides, Explaining with examples how to expand brackets that end up with […]


