
Maths IBAA – 5.072 Graphical behaviour of functions
£4.00
Graphical behaviour of functions – Maths IBAA – SL
Power Point presentation, 16 slides, Explaining how to use the first and second derivative to draw the sketch of the graph of a function, also, knowing the graph of one function either f, f’ or f” draw the sketch of the other two functions, based on the Maths IB Analysis and approaches Syllabus.
Preview
Related products
-
Maths IGCSE E1.08.3 Reverse percentage problems
£3.50Reverse percentage problems – Maths IGCSE Extended Power Point presentation, 7 slides, Explaining with examples and real life problems how to calculate the original amount given […]
-
Maths KS3 – 2.05.1 Functions and mapping
£3.50Functions and mapping – Maths KS3 Power Point presentation, 11 slides, Explaining with examples how express simple functions algebraically and represent them in mapping diagrams, based […]
-
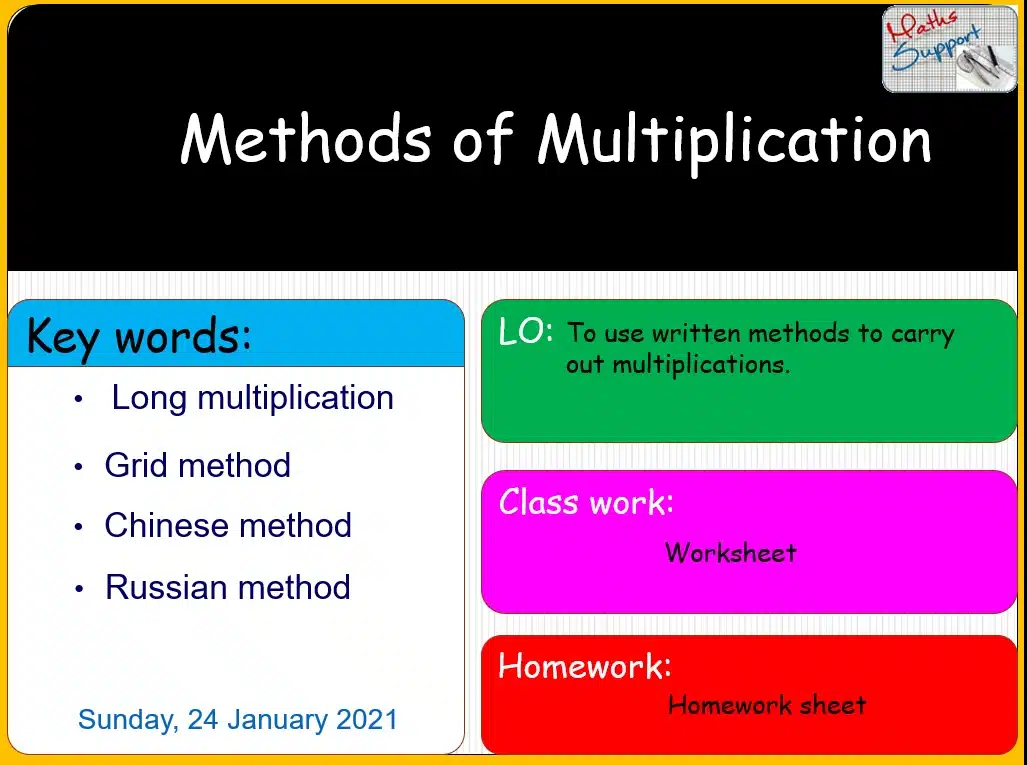
Maths KS3 – 1.02.2 Methods of multiplication
£4.00Methods of multiplication – Maths KS3 Power Point presentation, 19 slides, Explaining the following written methods to carry out multiplications: Long multiplication, Grid method, Chinese method, […]


