Maths KS3 – 4.04.0 Scatter graphs and correlation
£3.50
Description
Scatter graphs and correlation – Maths KS3
Power Point presentation, 7 slides, Explaining with examples what correlation is, and how to describe the correlation between the variables, based on the Maths KS3 National curriculum.
Related products
-
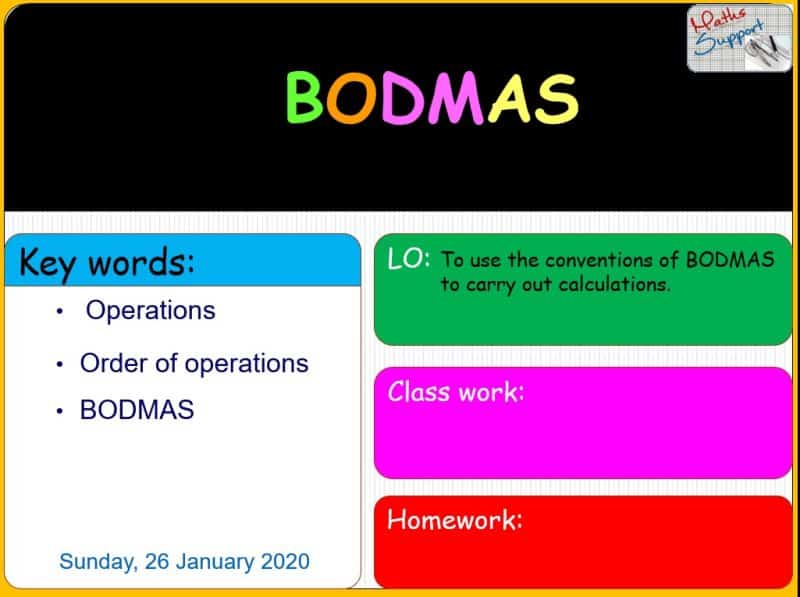
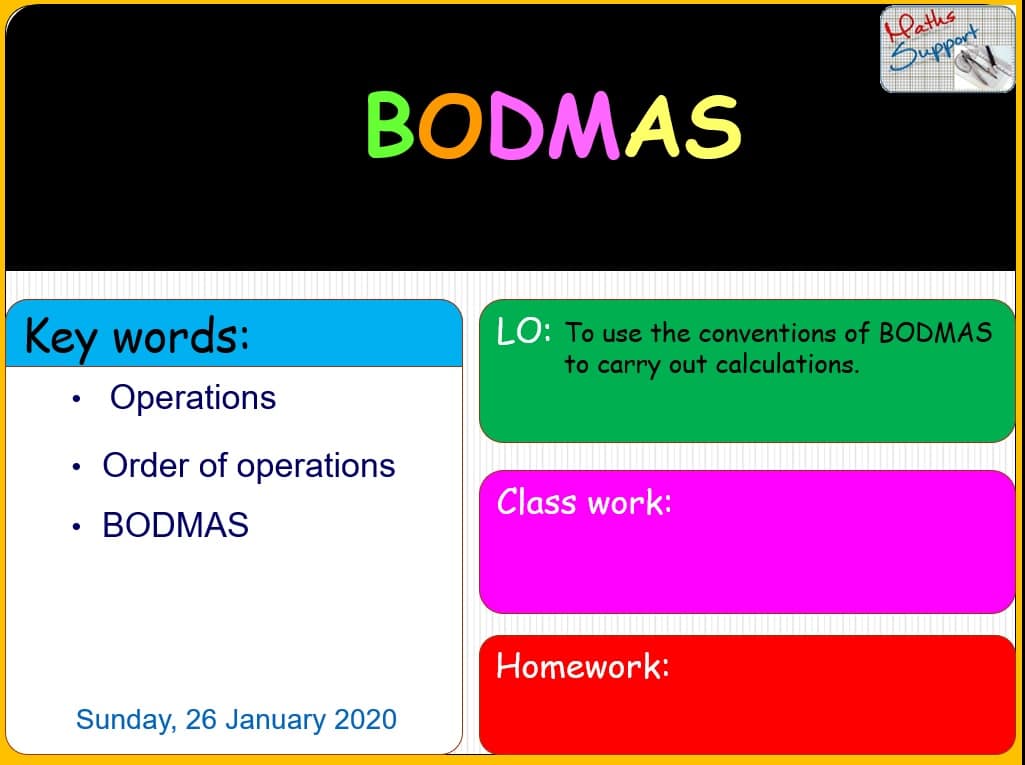
Maths KS3 – 1.02.1 Order of operations (BODMAS)
£3.50Order of operations (BODMAS) – Maths KS3 Power Point presentation, 12slides, Explaining the Order in which the operations are carried out to get the correct answer, […]
-
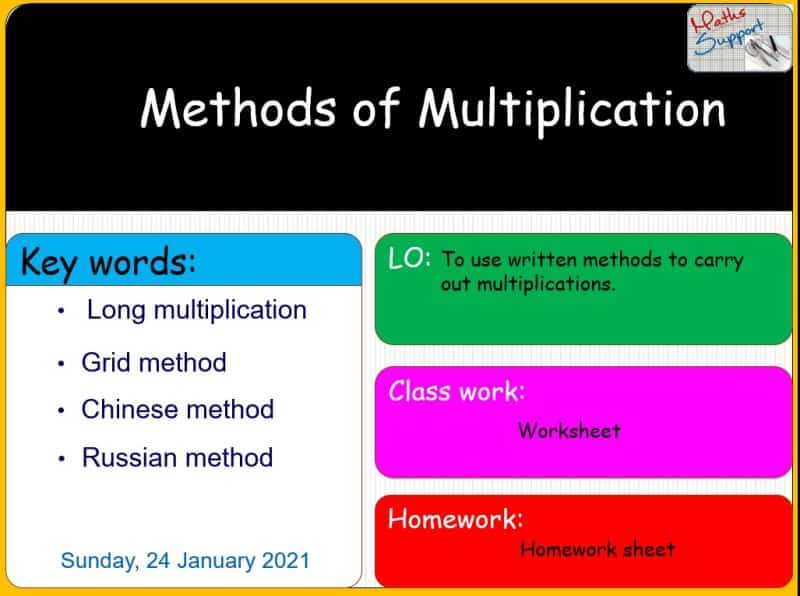
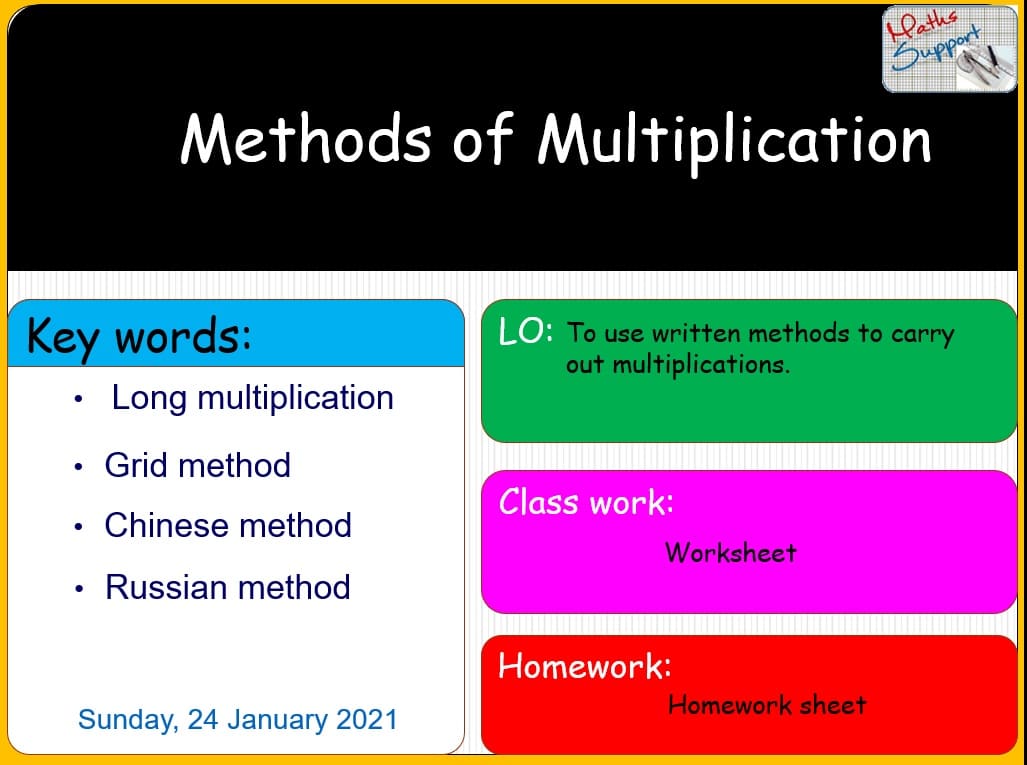
Maths KS3 – 1.02.2 Methods of multiplication
£4.00Methods of multiplication – Maths KS3 Power Point presentation, 19 slides, Explaining the following written methods to carry out multiplications: Long multiplication, Grid method, Chinese method, […]
-
Maths KS3 – 2.02.2 The nth term or a sequence
£3.50Find the nth term of a linear sequence – Maths KS3 Power Point presentation, 8 slides, Explaining with examples how to find the general term (nth […]