Maths KS3 – 4.04.1 Creating scatter graphs
£3.50
Description
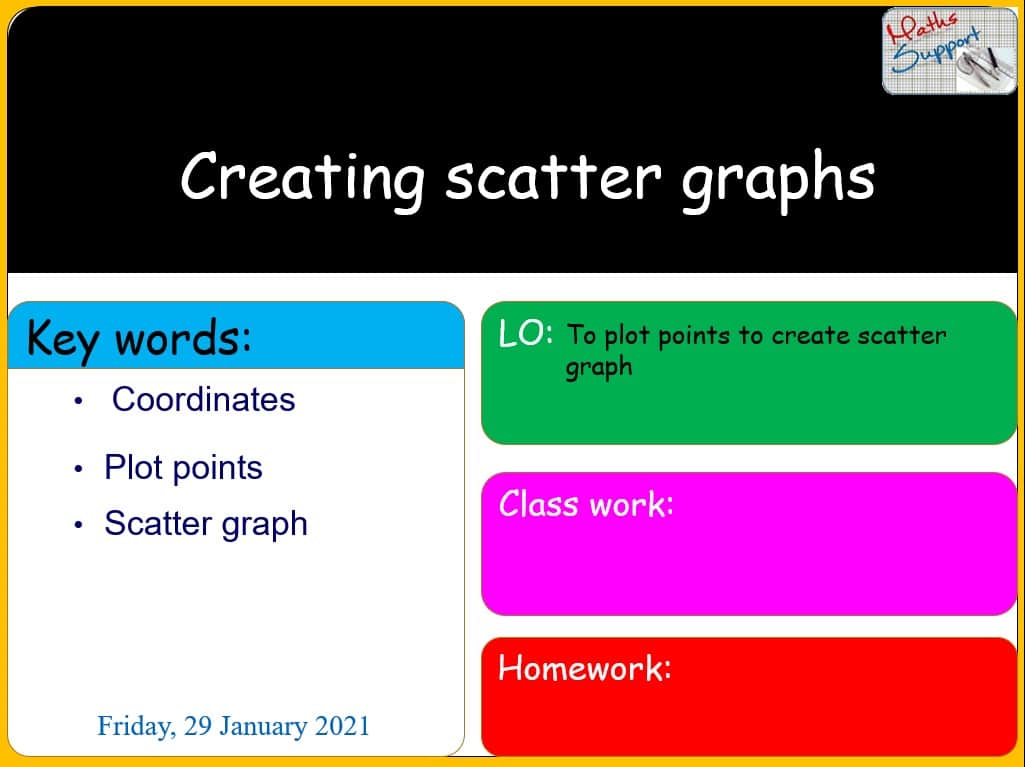
Creating scatter graphs – Maths KS3
Power Point presentation, 18 slides, Explaining with examples how to create a scatter diagram from a table, and how to use it to determine the correlation between the variables, based on KS3 Maths National curriculum.
Preview
Preview
Related products
-
Maths IBAI – 1.21 Arithmetic sequences
£5.00Arithmetic sequences – Maths IBAI – SL PowerPoint presentation, 10 slides, Explaining how to identify arithmetic sequences and how to find the nth term of an […]
-
Maths IGCSE E1.08.3 Reverse percentage problems
£3.50Reverse percentage problems – Maths IGCSE Extended Power Point presentation, 7 slides, Explaining with examples and real life problems how to calculate the original amount given […]
-
Maths IBAA – 5.090 Solving problems by integration
£4.00Solving problems by integration – Maths IBAA – SL Power Point presentation, 9 slides, Explaining how to use integration to solve daily-life problems involving rate of […]


