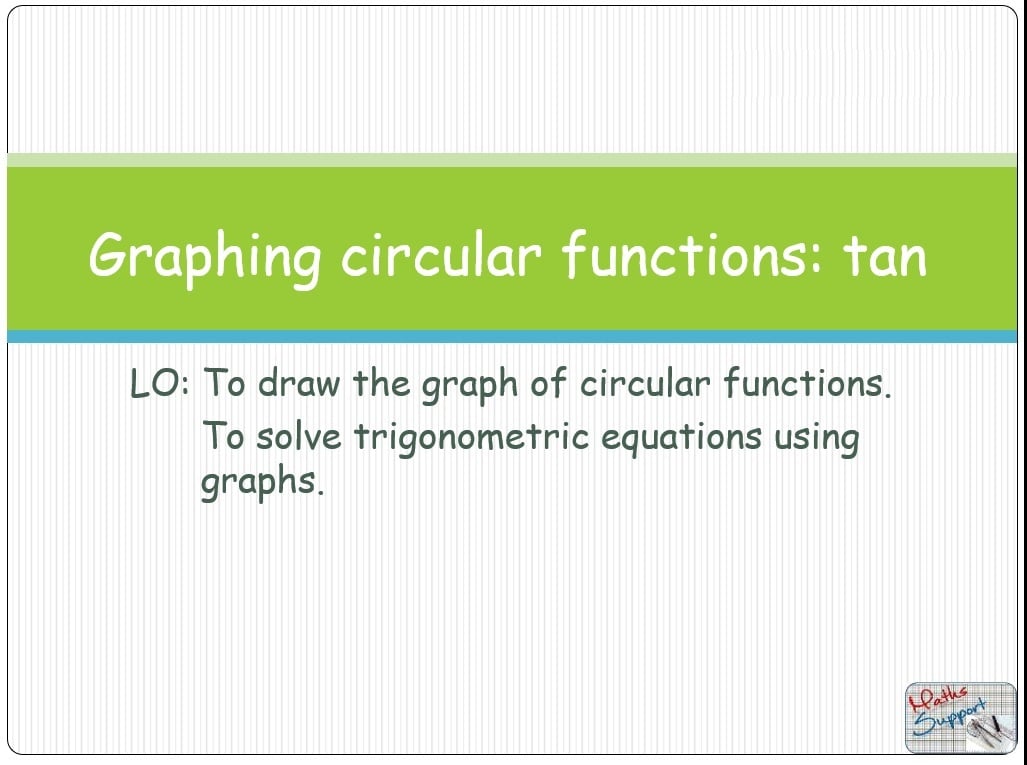
Maths IBAA – 3.71b Graphs of the circular functions: Tangent
£5.00
Description
Graphs of the circular functions: Tangent – Maths IBAA – SL
Power Point presentation, 17 slides, Explaining how to draw the tangent graph, and how to solve equations using the graphs on a GDC (Graphic display calculator) both Casio and TI, based on the Maths IB Analysis and approaches syllabus.
Power Point presentation
Be sure that you have an application to open this file type before purchasing.
Be sure that you have an application to open this file type before purchasing.
Preview
Preview
Related products
-
Maths IGCSE E2.70 The distributive law
£3.50The distributive law – Maths IGCSE Extended Power Point presentation, 9 slides, Explaining with examples how to use the distributive law to expand brackets, based on […]
-
Maths IBAA – 5.061.1 The derivative of ln x
£4.00The derivative of ln x – Maths IBAA – SL Power Point presentation, 15 slides, explaining how to find the derivative of functions involving ln x, […]
-
Maths IBAA – 5.090 Solving problems by integration
£4.00Solving problems by integration – Maths IBAA – SL Power Point presentation, 9 slides, Explaining how to use integration to solve daily-life problems involving rate of […]


