Maths KS3 – 2.06.1 Linear graphs from tables of values
£3.50
Description
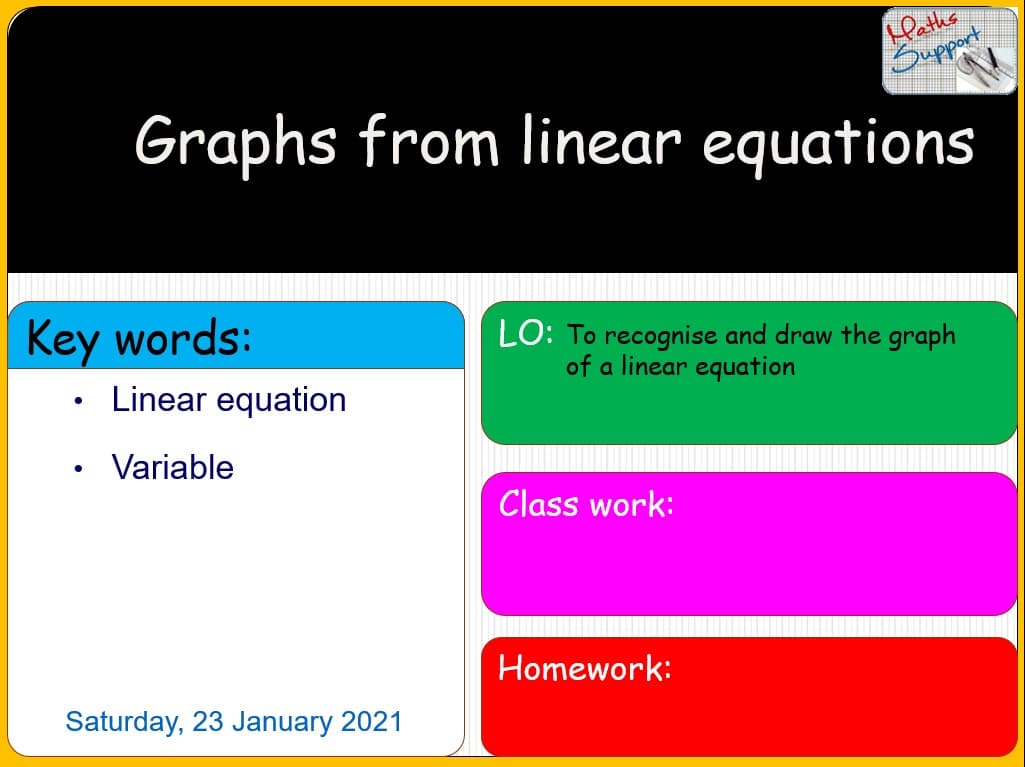
Linear graphs from tables of values – Maths KS3
Power Point presentation, 9 slides, Explaining with examples how to create a table of values to find and plot points to draw the graph of a linear equation, based on KS3 Maths National curriculum.
Preview
Preview
Related products
-
Maths KS3 – 2.03.1 Solving linear equations by balancing
£3.50Solving linear equations by balancing – Maths KS3 Power Point presentation, 14 slides, Explaining with examples how to solve simple linear equations using the balancing method, […]
-
Maths IBAA – 5.061.1 The derivative of ln x
£4.00The derivative of ln x – Maths IBAA – SL Power Point presentation, 15 slides, explaining how to find the derivative of functions involving ln x, […]
-
Maths KS3 – 1.02.5 Efficient use of a calculator
£3.50Efficient use of a calculator – Maths KS3 Power Point presentation, 9 slides, Explaining how to use a Scientific calculator to solve more complex operations such […]


