Maths KS3 – 2.06.1 Linear graphs from tables of values
£3.50
Description
Linear graphs from tables of values – Maths KS3
Power Point presentation, 9 slides, Explaining with examples how to create a table of values to find and plot points to draw the graph of a linear equation, based on KS3 Maths National curriculum.
Related products
-
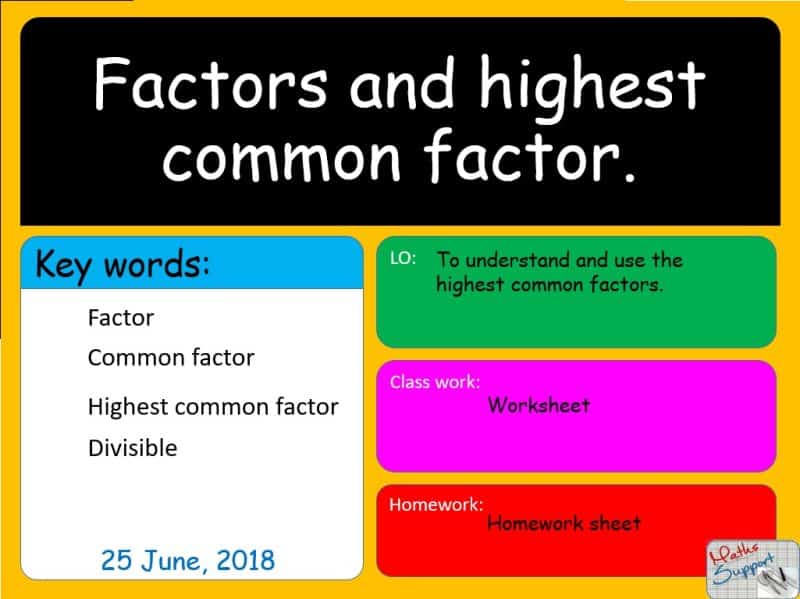
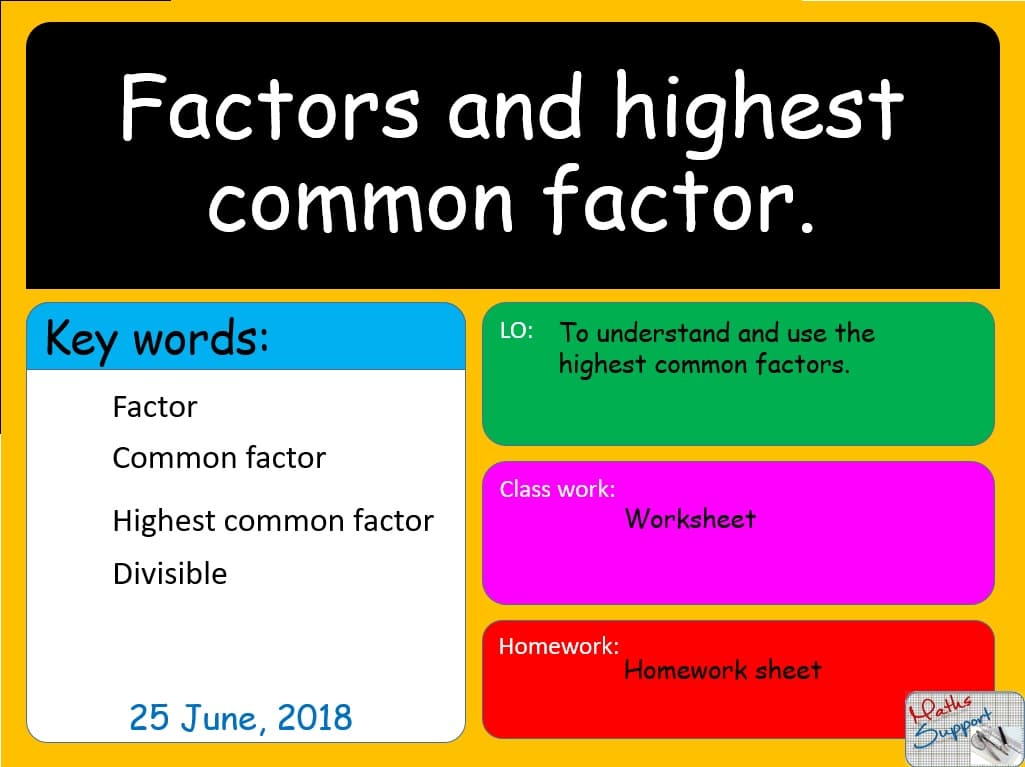
Maths KS3 – 1.03.2 Factors and Highest Common Factor
£3.50Factors and Highest Common Factor – Maths KS3 Power Point presentation, 8 slides, Explaining what common factors are and how to find the Highest Common Factor […]
-
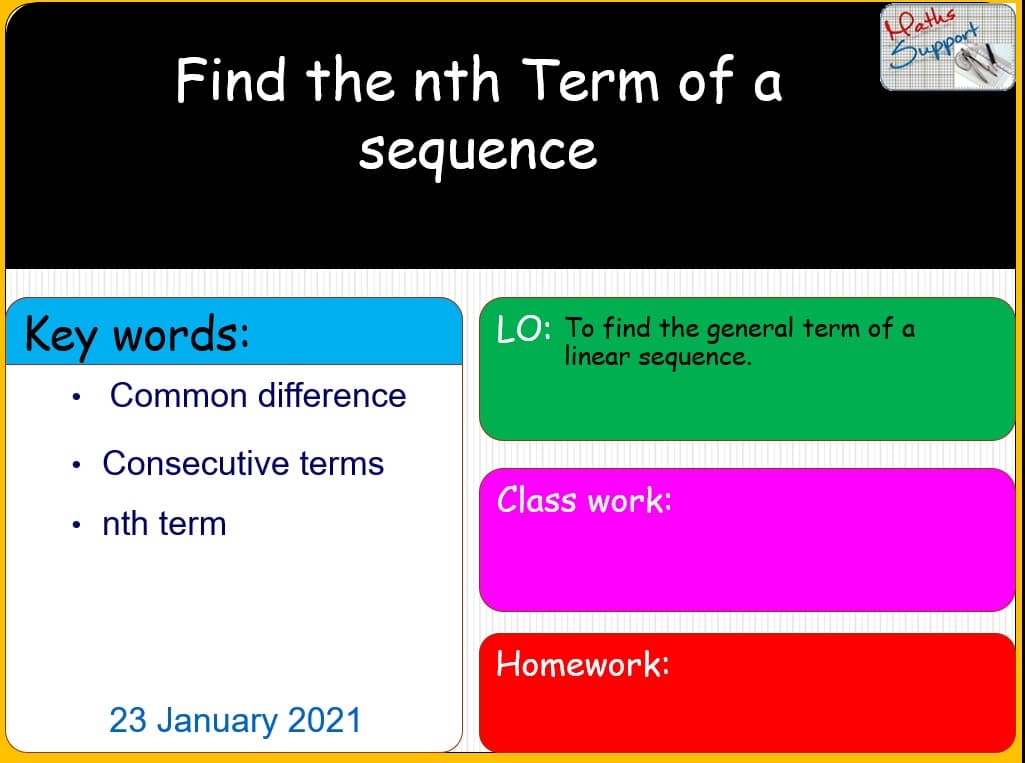
Maths KS3 – 2.02.2 The nth term or a sequence
£3.50Find the nth term of a linear sequence – Maths KS3 Power Point presentation, 8 slides, Explaining with examples how to find the general term (nth […]
-
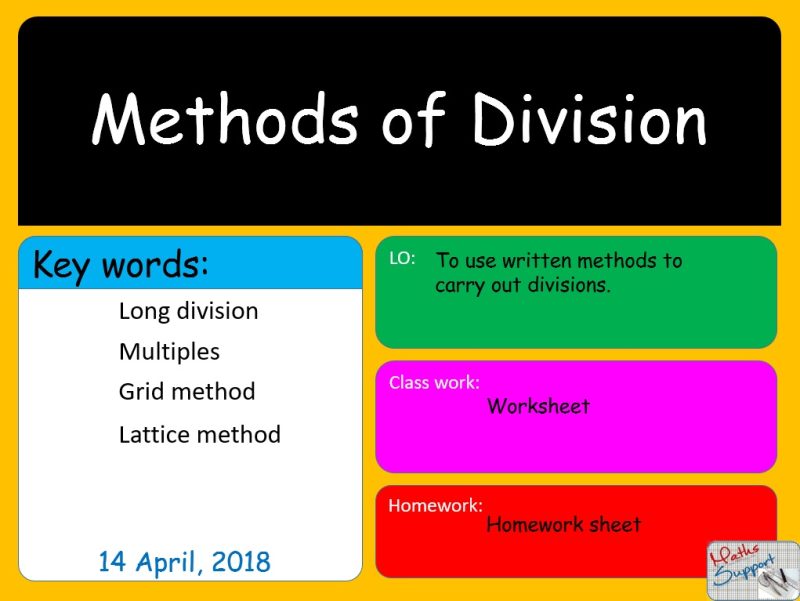
Maths KS3 – 1.02.4 Methods of division.
£4.00Methods of division – Maths KS3 Power Point presentation, 11 slides, Explaining how to divide using the following methods: Long division, Chunking method, Grid method, and […]