Maths KS3 – 2.06.0 Graphs of fixed values of x or y
£3.50
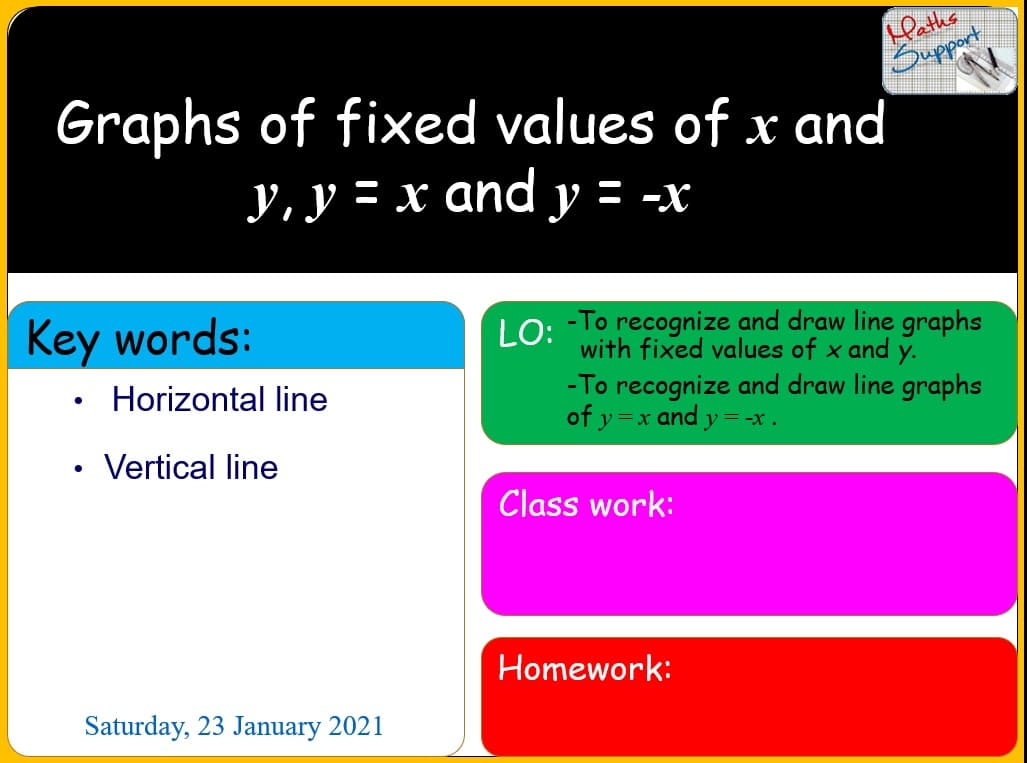
KS3 – Graphs of fixed values of x or y – Maths KS3
Power Point presentation, 8 slides, Explaining with examples how to recognize and draw line graphs with fixed values of x and y; and to recognize and draw line graphs of y = x and y = -x ; based on KS3 Maths National curriculum.
Preview
Related products
-
Maths IGCSE E2.70 The distributive law
£3.50The distributive law – Maths IGCSE Extended Power Point presentation, 9 slides, Explaining with examples how to use the distributive law to expand brackets, based on […]
-
Maths KS3 – 2.03.1 Solving linear equations by balancing
£3.50Solving linear equations by balancing – Maths KS3 Power Point presentation, 14 slides, Explaining with examples how to solve simple linear equations using the balancing method, […]
-
Maths IGCSE C1.80 Percentages
£3.50Percentages – Maths IGCSE Core Power Point presentation, 10 slides, Explaining what percentages are and work out the percentage of an amount, comparing by using percentages. […]


