Maths KS3 – 2.06.0 Graphs of fixed values of x or y
£3.50
Description
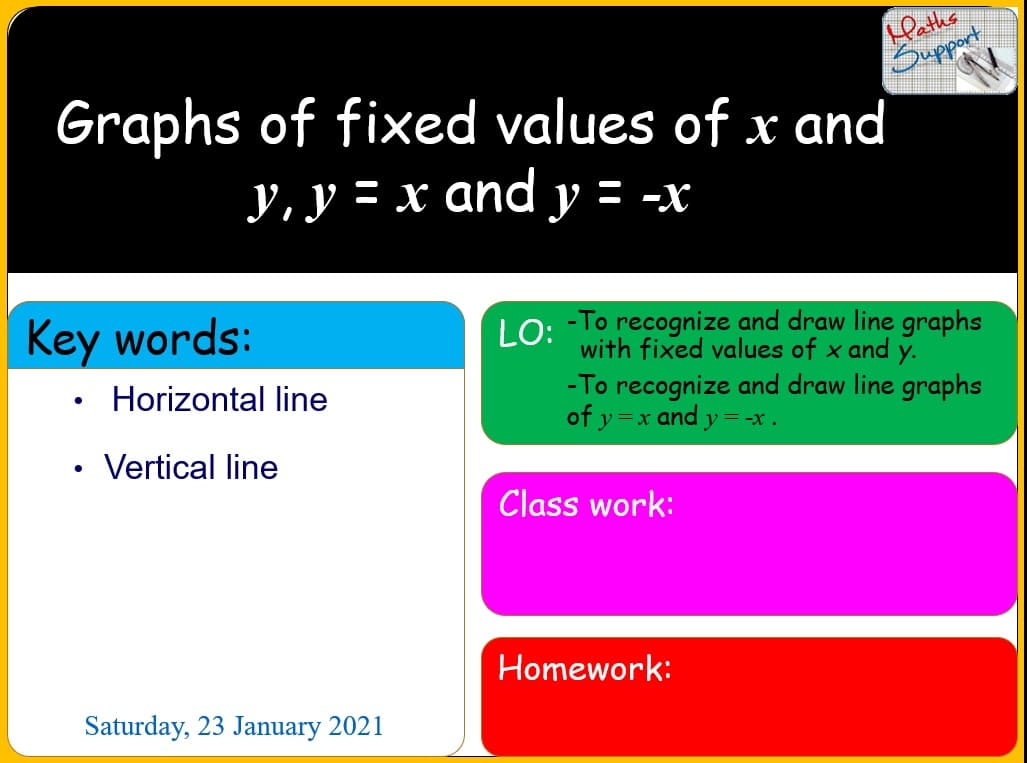
KS3 – Graphs of fixed values of x or y – Maths KS3
Power Point presentation, 8 slides, Explaining with examples how to recognize and draw line graphs with fixed values of x and y; and to recognize and draw line graphs of y = x and y = -x ; based on KS3 Maths National curriculum.
Preview
Preview
Related products
-
Maths KS3 – 1.04.1 Divide in a given ratio
£3.50Divide in a given ratio – Maths KS3 Power Point presentation, 13 slides, Explaining with examples how to solve simple problems about ratio and proportion using […]
-
Maths KS3 – 1.03.1 Prime factors
£3.50Prime factors – Maths KS3 Power Point presentation, 12 slides, Explaining what prime factors are and how to find the prime factors of any number using […]
-
Maths KS3 – 2.02.2 The nth term or a sequence
£3.50Find the nth term of a linear sequence – Maths KS3 Power Point presentation, 8 slides, Explaining with examples how to find the general term (nth […]


